
See also


 06.10.2026 09:26 AM
Bitcoin trades around $85,600, but the most interesting developments right now are not on the price chart but in miners' data. The Puell Multiple has settled above 1 and, according to CryptoQuant, reached an 11-month high — about 1.07 on October 4–5. This indicates Bitcoin is exiting an accumulation zone.

The indicator compares miners' daily dollar revenue to the 365-day moving average. A value below 1 means revenues are below the annual average, and such periods have historically often coincided with BTC accumulation. A return above 1 signals revenue recovery. Recall that at the start of 2026 the indicator opened around 0.86 and declined for a long time; on September 22 it touched 1.08, then retraced to 1.05 by month-end. So this is not a sudden spike but a consolidation above 1 — and it is the consolidation that I consider the signal.
A target of 2 looks reachable because the indicator is still far from overheating zones: historically, values above 4 coincided with cycle tops in 2013, 2017 and 2021. The winners here are miners, whose revenue has moved above the annual average, which removes forced selling pressure. Short sellers lose as the market squeezes them out.
A caveat: the Puell Multiple is derived from price, so I view it more as confirmation of recovery than a leading signal. It is an important confirmation, however: it coincides with renewed inflows to spot ETFs and with buybacks on pullbacks. Price behavior remains decisive: since September 21, Bitcoin has tried four times to break the $87,000 area, and the 2026 yearly open at $87,570 has held. Funds also recently returned to outflows, and on Tuesday the market awaits the Federal Reserve's September meeting minutes.
My base case remains bullish. While Bitcoin holds above $85,000, I expect a move to $86,200, then toward the $87,000 area, and a close above $87,570 would open the way to $90,000. A loss of $85,000 would return the price to $84,300 and delay the scenario.
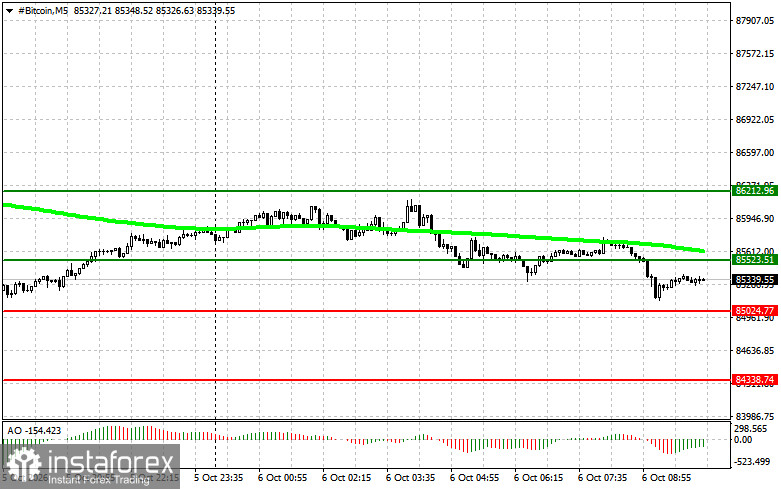
For Bitcoin, the price trades in a narrow range between support at 85,000 and resistance at 85,500, with outer boundaries at 84,300 and 86,200, and the plan is built around two mirrored directions with a full set of breakout and rejection scenarios. There are two entries for buying. First: a confirmed breakout above 85,500 — buy targeting 86,200, where I take profit and consider a short on the pullback, provided price is above the 50-day moving average and the Awesome Oscillator is above zero. Second: a rejection off 85,000 if the downside breakout fails and the spike proves false — buy for a return first to 85,500 and then to 86,200.
Sell positions are symmetric. On a confirmed breakdown of 85,000 to the downside, consider a short targeting 84,300, provided the moving average is above price, and the Awesome is below zero. If an upside breakout of 85,500 fails and price returns below that level, short from resistance aiming back to 85,000 and then 84,300.
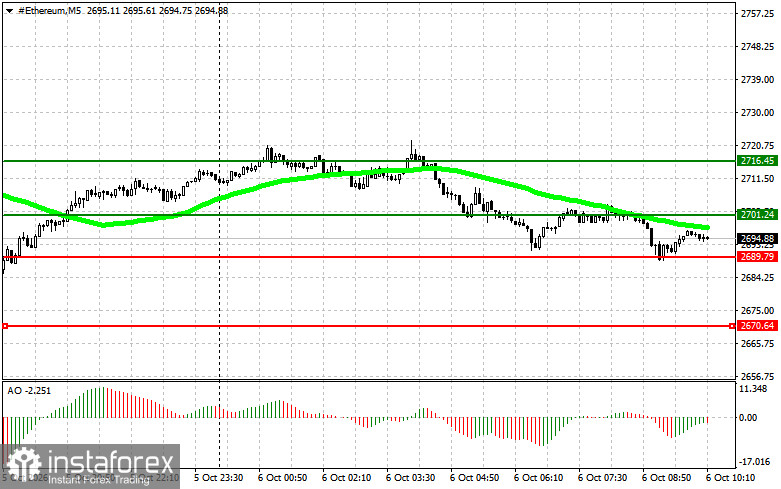
For Ether, the logic fully mirrors Bitcoin on its own price scale: the inner range is between support 2,689 and resistance 2,701, with outer boundaries at 2,670 and 2,716. Buy on a confirmed breakout above 2,701, targeting 2,716, where you take profit and may consider a short position on the pullback; conditions are the same—price above the 50-day moving average and Awesome above zero. Buy on a rejection from 2,689, if the downside breakout fails, initially toward 2,701 and then 2,716.
For sell positions, a confirmed breakdown of 2,689 opens a short targeting 2,670, provided the moving average is above price and Awesome is below zero. A rejection from 2,701, if the upside breakout fails, gives a short for a return to 2,689 and then 2,670. Both indicators filter out false moves, not as standalone reasons to enter early, and trades are taken only after price confirms the specified levels.


