
Vea también


 07.10.2026 04:48 AM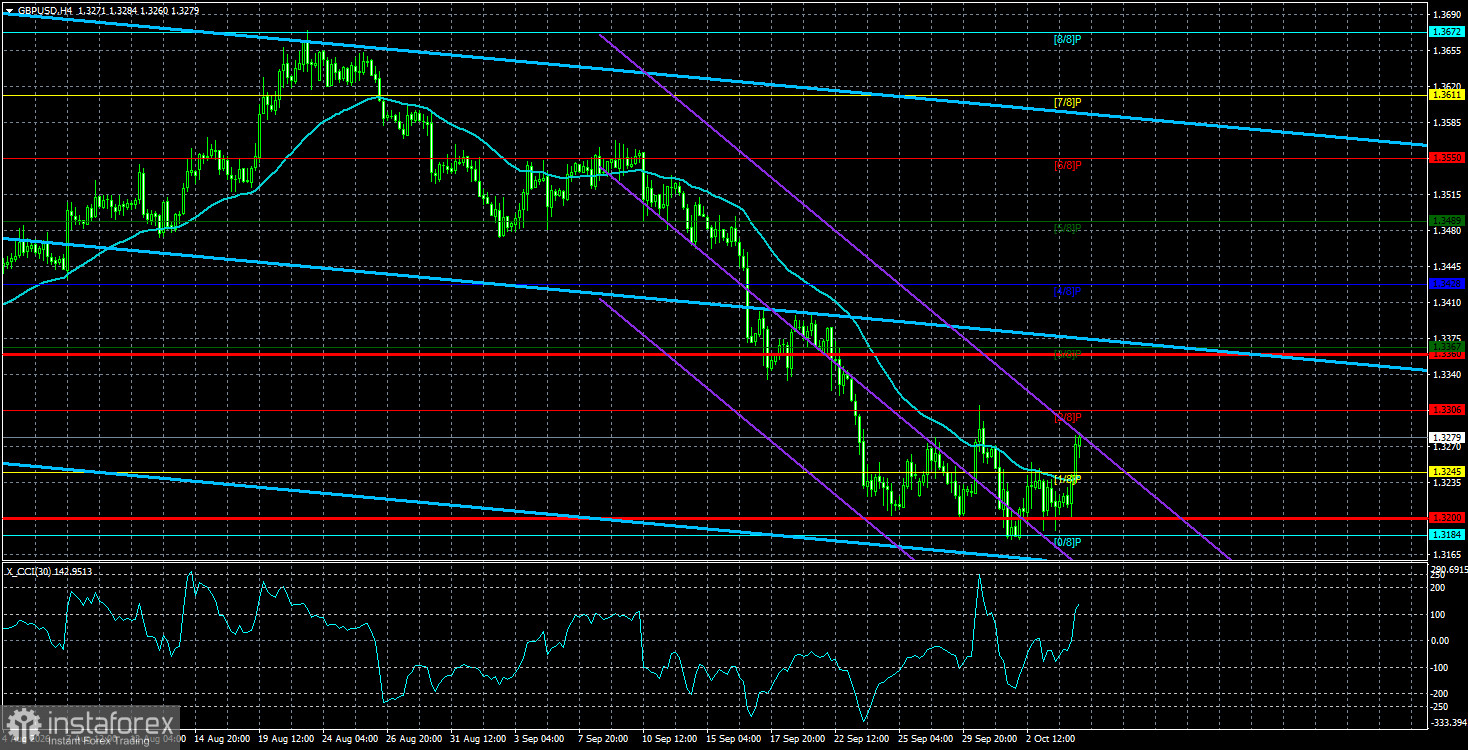
The GBP/USD currency pair also showed a fairly confident rise on Tuesday. It is as difficult to say on what basis the dollar fell sharply as it was to explain why the dollar rose throughout the month. We have previously said the recent declines in EUR/USD and GBP/USD were technical, illogical and speculative: the dollar rose because it was being bought, and it was bought because it was rising. But every process and every trend ends sooner or later.
In our EUR/USD analysis, we repeatedly drew traders' attention to higher timeframes and concluded the decline was corrective. That conclusion is even more relevant and obvious for GBP/USD. On the weekly timeframe, you can clearly see not only a correction but a sideways channel in which price has traded for a year. Since the last move took price down to the channel's lower boundary, it is logical to expect a move back toward the upper boundary. Because there were no strong reasons for the dollar's large rise in September–October, no local catalysts are required to drive the pound higher. The pound remains flat, so movements inside the sideways channel can be anything.
The market may also remember that inflation is rising not only in the US, and that it is not only the Federal Reserve tightening policy. It may recall Donald Trump's trade war and protectionist policy and serious problems in the US economy despite formal growth. Put simply, when you sum the facts, we see no solid basis for further dollar strength. In 2026, the geopolitical factor supported the dollar, and then the market desperately awaited Fed tightening, apparently pricing in as many as five hikes. But by early October, it is clear that, with the current state of the labor market, it will be hard to keep raising the policy rate much.
Meanwhile, the Bank of England is preparing for its own first tightening in response to accelerating inflation — and that tightening is unlikely to be the last. Recall Kevin Warsh, a Trump appointee, leads the Fed. The BoE is led by Andrew Bailey, who can act without the same political pressure: Trump is not the UK's president. Trump continues to call for Jerome Powell's removal even though Powell is no longer Fed chair; Trump is calling for rate cuts, while the BoE can set policy as it sees fit. Therefore, the hawkish prospects are clearly stronger at the BoE.
Last week several MPC members said they were prepared to vote for a rate increase, and this week Sarah Breeden said a hike is increasingly appropriate. Thus the question of when the Fed will raise next remains open, while the BoE could raise rates twice in the coming months.
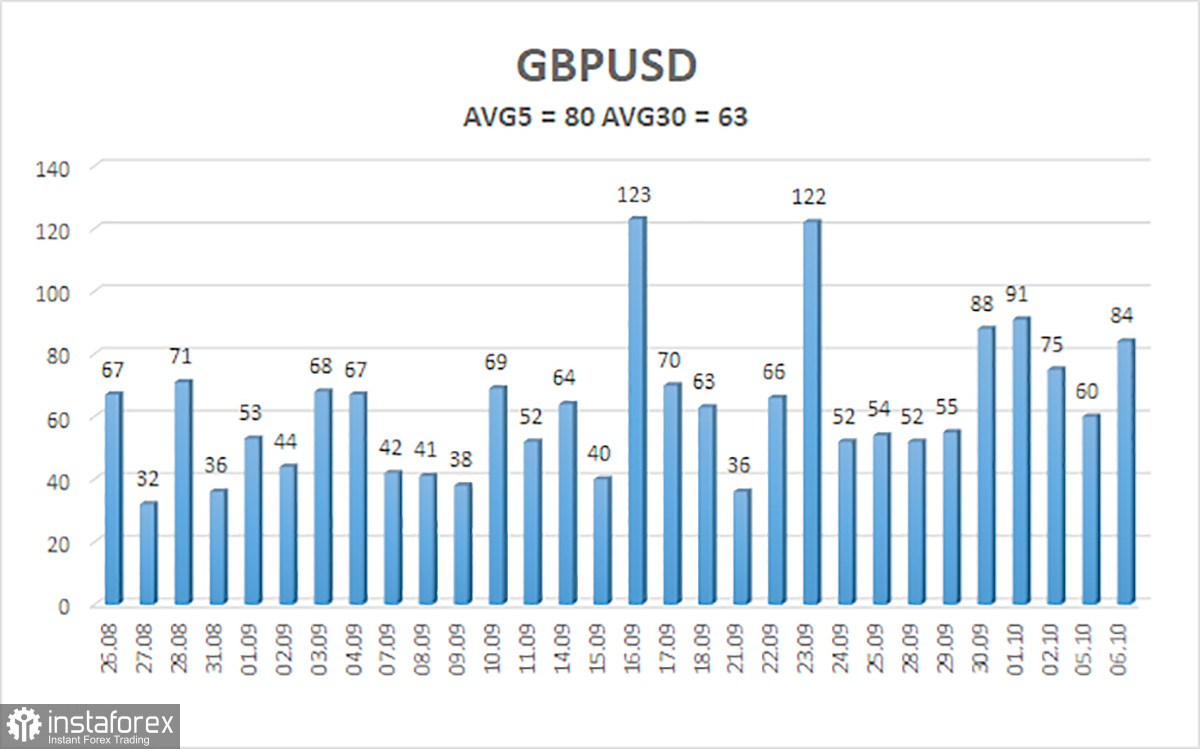
The average volatility of the GBP/USD pair over the last 5 trading days is 80 pips. For the pound/dollar pair, this value is "average." On Wednesday, October 7, therefore, we expect movement within the range bounded by levels 1.3200 and 1.3360. The higher linear-regression channel has turned down again. The CCI indicator entered the oversold area twice already, which warns of a possible end to the downward trend.
S1 – 1.3245
S2 – 1.3184
S3 – 1.3123
R1 – 1.3306
R2 – 1.3367
R3 – 1.3428
The GBP/USD currency pair continues its illogical downward movement. Trump's policies will continue to put pressure on the US economy, so we do not expect the US dollar to strengthen in the long term. So far, 2026 has been favorable for the dollar due to geopolitical risk and inflation, which drove capital into safety and pushed the Fed back toward tightening. However, on the weekly timeframe, a flat range persists between 1.3150 and 1.3780 within a four-year uptrend, supporting the case for medium-term pound appreciation. Consider long positions with targets of 1.3367 and 1.3428 when price is above the moving average. Price below the moving average allows bearish trading, with targets of 1.3184 and 1.3141. Be cautious with short positions, as price is currently near the lower boundary of the long-term sideways channel.


