See also

 20.01.2026 06:09 PM
Trade analysis and trading tips for the Japanese yen
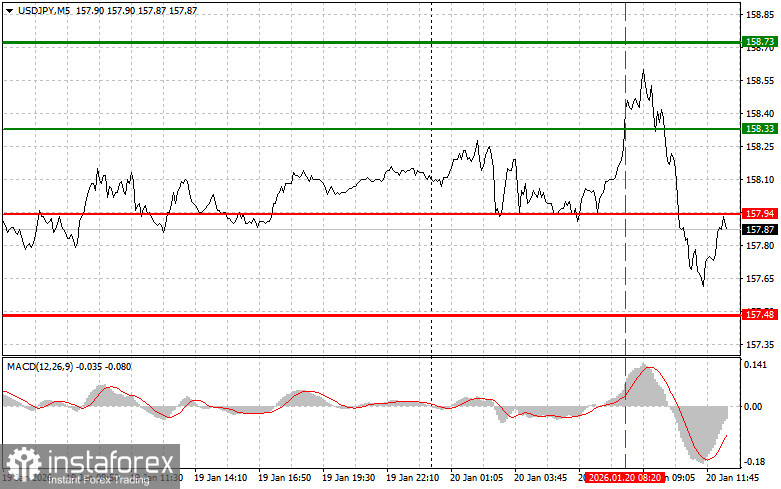
The test of the 158.33 price level occurred at a moment when the MACD indicator had already moved significantly upward from the zero line, which limited the pair's upward potential. For this reason, I did not buy the dollar.
The yen managed to strengthen against the U.S. dollar, which came under strong selling pressure amid the escalating geopolitical conflict between the U.S. and the EU over Greenland. The unexpected flare-up around the strategically important, resource-rich island triggered a flight from the dollar into safe-haven assets, among which the Japanese currency is traditionally included. Yen strength has also been supported by expectations of a more hawkish monetary policy from the Bank of Japan in the near future.
At the same time, growing concerns about the outlook for the global economy—driven by the risk of new trade wars and rising geopolitical tensions—are putting additional pressure on the dollar. Investors fear that the conflict over Greenland could become a catalyst for further deterioration in transatlantic relations and destabilization of global trade. In the current environment, the yen looks like an attractive asset for conservative investors seeking to protect their capital from market volatility.
As for the intraday strategy, I will rely more on the implementation of scenarios No. 1 and No. 2.
Buy signal
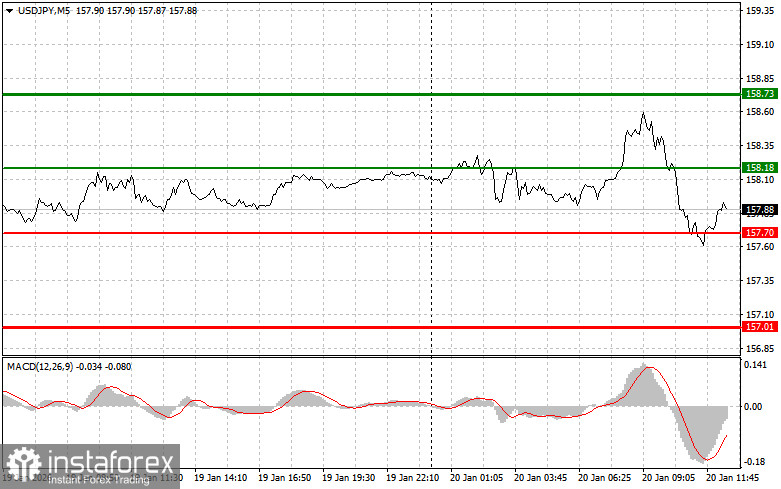
Scenario No. 1: Today, I plan to buy USD/JPY upon reaching the entry point around 158.18 (the green line on the chart), with a target of growth toward the 158.73 level (the thicker green line on the chart). Around 158.73, I will exit long positions and open short positions in the opposite direction (aiming for a 30–35 point move in the opposite direction from that level). Further upside in the pair can be expected in line with the trend.Important! Before buying, make sure that the MACD indicator is above the zero line and is just beginning to rise from it.
Scenario No. 2: I also plan to buy USD/JPY today in the event of two consecutive tests of the 157.70 price level when the MACD indicator is in oversold territory. This would limit the pair's downward potential and lead to a reversal of the market upward. Growth toward the opposite levels of 158.18 and 158.73 can be expected.
Sell signal
Scenario No. 1: Today, I plan to sell USD/JPY after the 157.70 level is updated (the red line on the chart), which would lead to a rapid decline in the pair. The key target for sellers will be the 157.01 level, where I will exit short positions and also immediately open long positions in the opposite direction (aiming for a 20–25 point move in the opposite direction from that level). Pressure on the pair may return at any moment today.Important! Before selling, make sure that the MACD indicator is below the zero line and is just beginning to decline from it.
Scenario No. 2: I also plan to sell USD/JPY today in the event of two consecutive tests of the 158.18 price level when the MACD indicator is in overbought territory. This would limit the pair's upward potential and lead to a reversal of the market downward. A decline toward the opposite levels of 157.70 and 157.01 can be expected.
What is shown on the chart:
Important. Beginner traders in the Forex market should make entry decisions very cautiously. Ahead of major fundamental reports, it is best to stay out of the market to avoid being caught in sharp price fluctuations. If you decide to trade during news releases, always place stop-loss orders to minimize losses. Without stop-loss orders, you can lose your entire deposit very quickly, especially if you do not use proper money management and trade large volumes.
And remember that successful trading requires a clear trading plan, such as the one presented above. Spontaneous trading decisions based on the current market situation are inherently a losing strategy for an intraday trader.


