See also

 13.05.2026 05:49 PM
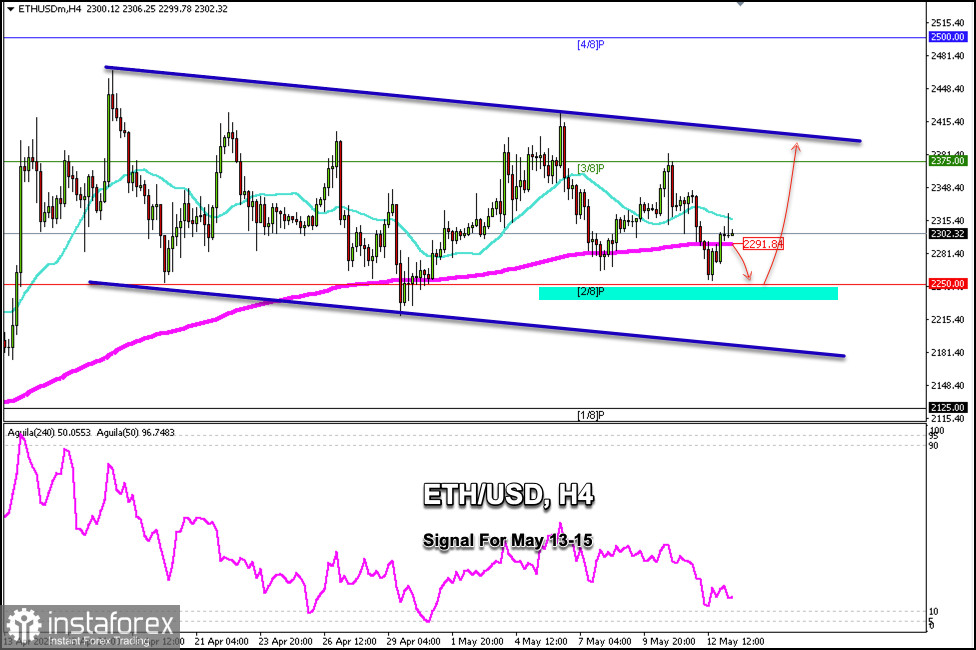
ETH/USD is trading around $2,303, above the 21-day SMA and the 200-day EMA, showing a technical rebound but also signs of exhaustion. ETH is trading within a range of $2,435 to $2,200.
According to the H4 chart, we can see that Ethereum is within a bearish trend channel formed since April 15. If the price falls below $2,300, it could continue its downward movement until it finds the 2/8 Murray support around $2,250.
The 2/8 Murray support level could provide a good technical bounce for ETH/USD and could be seen as an opportunity to open long positions with targets at $2,291 and $2,375.
A sharp drop below $2,250 could extend the decline to the lower band of the bearish trend channel around $2,180, and the instrument could even reach the 1/8 Murray line around $2,125.
Our trading plan for the coming hours is to sell Ethereum below $2,300 toward the 6/8 Murray level and buy above the 6/8 Murray level with targets toward the 21 SMA.
You have already liked this post today
*The market analysis posted here is meant to increase your awareness, but not to give instructions to make a trade.


