Vea también

 29.06.2026 03:55 AM
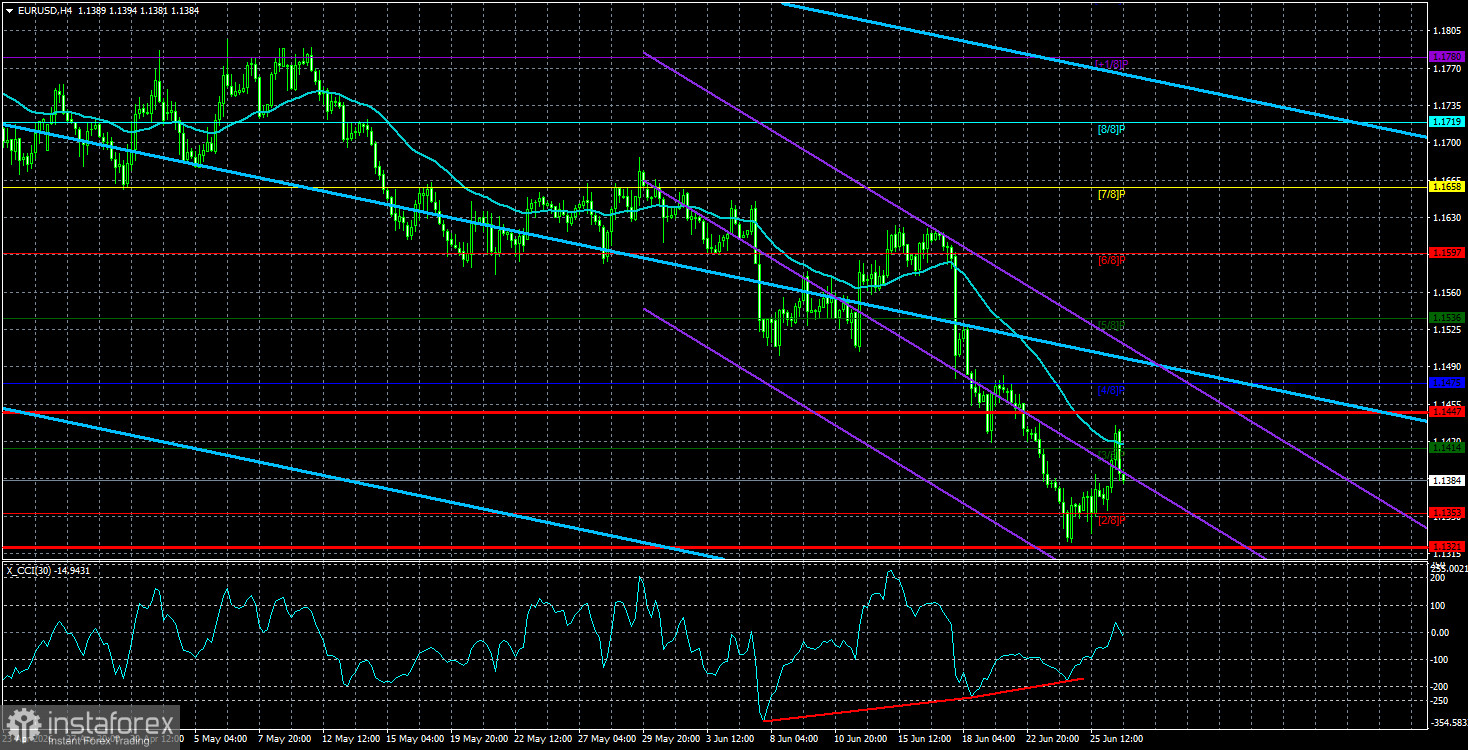
The EUR/USD currency pair on Friday attempted to initiate a long-awaited and logical upward movement, but... it did not work out again. While the European currency showed strong growth in the first half of the day, it retreated back down in the second half, effectively negating "all the hard-earned gains." As a result, the pair remained below the moving average line and continued within a downward trend that has lasted for more than two months, leaving all questions from recent weeks unanswered.
Let's recall that the most popular view in the currency market explaining the rise of the dollar over the last two weeks is the Federal Reserve's monetary policy. Specifically, the Fed's hawkish stance at its last meeting. The market is now expecting one, or even two, rate hikes by the end of the year, and is actively buying the U.S. dollar on this basis. Notably, the market did not even notice the European Central Bank's tightening policy, which is the first "crack" in the most common conclusion. If the market is not interested in the ECB's position, does that mean all news from the Eurozone can simply be ignored?
We believe that the latest surge in the American currency can be explained either very simply or very complexly. The first option (the simple one) is that there is a trend and the market is trading in line with it. It has been a purely speculative, technical movement, essentially inertia, in recent weeks. The second option (the complex one) is that large players, market makers, are aware of something that is not accessible to regular retail traders. In other words, there is some information that is "not for the general public." What kind of information could this be? One can only speculate, but considering the events of the last three days in the Middle East, it could be assumed that major capital is aware that the war between Iran and the U.S. will continue in one form or another, no real deal will be signed, and the Strait of Hormuz will remain at least partially blocked. This is why the dollar is once again in demand as a safe-haven asset. We have no other explanations for what is happening.
A week ago, a framework agreement was signed between Iran and the U.S., and on Friday, a similar agreement was signed between Israel and Lebanon. What has changed? Nothing. Israel continues to bombard Lebanon, refuses to withdraw its troops, and Hezbollah does not plan to end the conflict. The same is happening next door. Iran attacked a commercial vessel and attempted to attack several others; the U.S. considered this incident a violation of the ceasefire and struck Iranian infrastructure. Iran viewed this incident as a violation of the terms of the deal and attacked American military bases in Kuwait and Bahrain. Essentially, negotiations are frozen again, but Iran wasn't exactly rushing to sign a nuclear agreement with Washington on Donald Trump's terms. We still believe that peace is unattainable in the near future. If so, oil prices briefly fell again. The U.S. dollar, even in this case, has already reacted to the new escalation and the cancellation of the ceasefire.
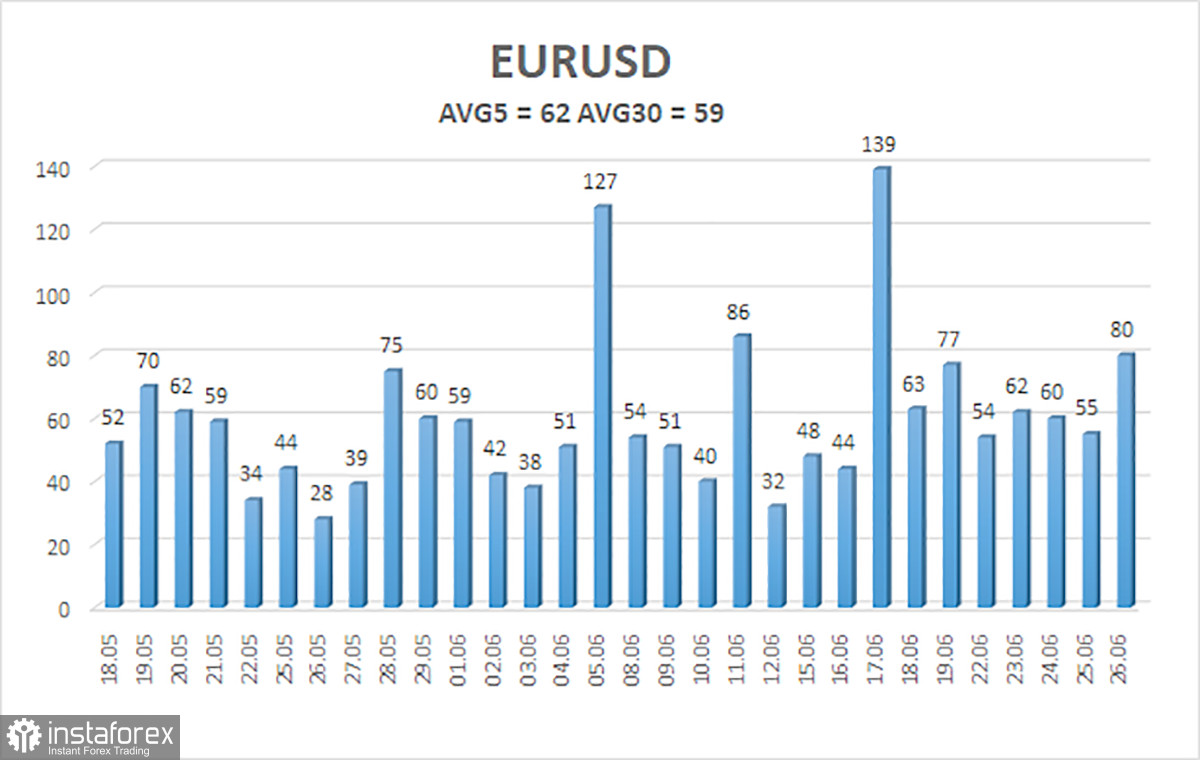
The average volatility of the EUR/USD currency pair over the last five trading days, as of June 29, is 62 pips, which is considered "average." We expect the pair to move between 1.1321 and 1.1447 on Monday. The upper channel of the linear regression has turned downward, indicating a continuation of the downward trend. The CCI indicator has entered the oversold area and has already formed two "bullish" divergences, warning of a potential end to the downward trend. However, the market is currently ignoring absolutely all factors.
S1 – 1.1353
S2 – 1.1292
S3 – 1.1230
R1 – 1.1414
R2 – 1.1475
R3 – 1.1536
The EUR/USD pair continues its downward movement, presumably a correction within a global upward trend, as is clearly seen on the daily or weekly timeframe. The global fundamental backdrop for the dollar remains negative, but in 2026, initially, geopolitical factors, followed by the hawkish stance of the Fed, have provided strong support for the American currency. When the price is below the moving average, short positions can be considered with targets at 1.1353 and 1.1321. Above the moving average line, long positions are relevant with targets at 1.1536 and 1.1597. Bears are currently very strong for no apparent reason.
Linear regression channels help determine the current trend. If both are directed in the same way, the trend is currently strong;
The moving average line (settings 20.0, smoothed) defines the short-term trend and the direction in which trading should proceed;
Murray levels are target levels for movements and corrections;
Volatility levels (red lines) indicate the probable price channel within which the pair will move in the coming day based on current volatility metrics;
The CCI indicator – its entry into the oversold area (below -250) or the overbought area (above +250) indicates that a trend reversal is approaching in the opposite direction.


