Vea también

 24.06.2026 06:36 PM
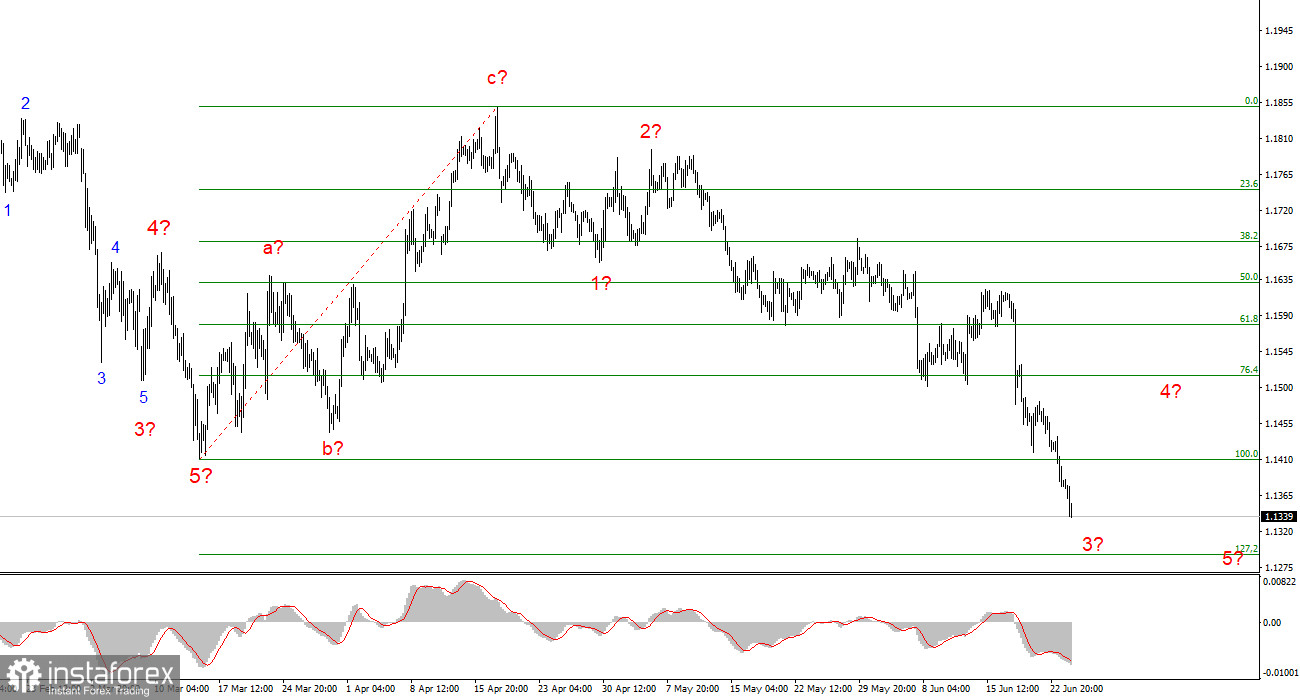
The wave pattern on the 4-hour chart for EUR/USD is becoming more complex. There is still no indication that the upward trend segment (shown in the lower chart), which began in January of last year, has been canceled. However, the trend structure has now taken on a corrective form. From a long-term perspective, wave C is expected to develop, with its low likely falling below the low of wave A. At the moment, it is difficult to believe in such a deep decline of the euro given that the conflict in the Middle East has ended. Nevertheless, demand for the U.S. dollar remains strong, which means the anticipated wave C may ultimately develop into a complete structure.
On the lower timeframe, I can identify a classic five-wave bearish structure. If this assumption is correct, wave 3 is currently unfolding and has already taken on a clearly defined five-wave form. Once this structure is complete, the instrument may transition into an upward corrective sequence. However, according to the current wave count, wave 5 still remains to be formed.
The EUR/USD pair declined by another 50 basis points on Wednesday, and that was only by the beginning of the U.S. session. By the end of the day, the euro could easily lose another 50 points, and few market participants would be surprised.
Looking at the broader picture, I did not expect such a strong appreciation of the U.S. dollar and do not believe it is entirely justified by fundamentals. However, markets do not always move according to logic or clear reasons. Price action must be accepted as it is. Arguing that the current move should not be happening serves little purpose.
Under the current circumstances, traders are searching for new explanations for the dollar's strength. If one looks closely enough, such explanations can be found. For example, according to the CME FedWatch Tool, the probability of further Federal Reserve tightening by the end of the year is increasing. Previously, the market expected one rate hike; now, expectations are shifting toward two.
Only 14% of surveyed market participants believe that the federal funds rate will remain at 3.50% after the final FOMC meeting of 2026. Around 37% expect one 25-basis-point rate hike. Another 34% anticipate two rounds of tightening, while 15% expect three or more. As always, the truth likely lies somewhere in the middle, but the trend toward increasingly hawkish expectations is evident and may be the primary driver of the U.S. dollar's recent strength. I see no other convincing explanation.
Despite Donald Trump's continued confrontational rhetoric and frequent contradictory statements, negotiations with Iran are ongoing. Analysts increasingly point to progress in the talks and a realistic possibility of achieving a lasting peace agreement. Oil prices have already fallen to approximately 75% of their recent highs, offering hope for slower inflation. Based on these developments, I would not be overly confident about a persistently hawkish Federal Reserve through year-end. Nevertheless, there are few other ways to explain the dollar's appreciation in recent weeks.
From a wave analysis perspective, the picture remains straightforward: wave C continues to develop.
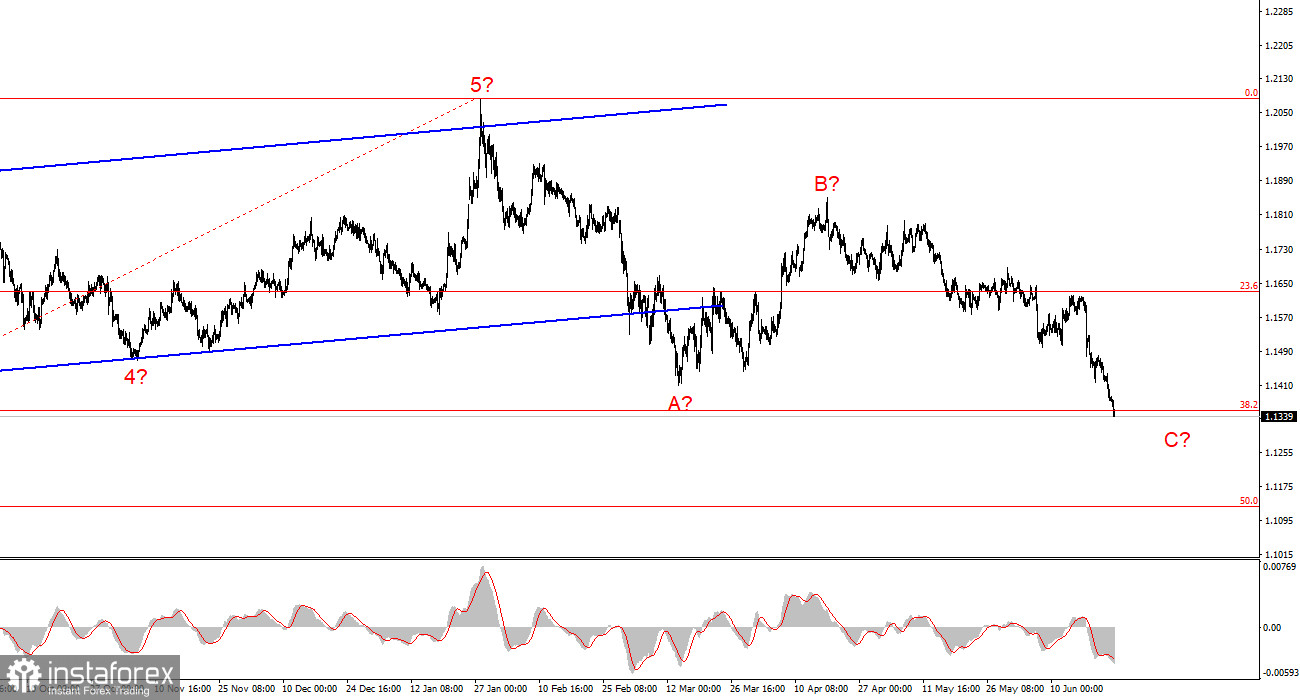
Based on my EUR/USD analysis, I conclude that the instrument remains within a broader upward trend segment (shown in the lower chart), while in the shorter term it is trading within a downward trend segment.
In my view, the current environment may offer a reasonable opportunity to consider long positions. However, the pair may decline well below the 1.1400 level as part of wave C. If this scenario proves correct, it may be wiser to wait for wave 5 of C to develop before considering long exposure. Moreover, the increasingly positive geopolitical backdrop is no longer acting as a headwind for the U.S. dollar.
On the higher timeframe, an upward trend segment remains visible, followed by the development of a corrective wave structure. In the near term, wave C is expected to continue toward targets around 1.1352, which corresponds to the 38.2% Fibonacci retracement level. Once the A-B-C structure is complete, a new long-term upward trend may begin.
Key Principles of My Analysis:


