Vea también

 24.06.2026 11:02 AM
Not all that glitters is gold. XAU/USD has fallen in four of the last five sessions. The metal, long regarded as a safe haven, is weakening precisely during large sell-offs in US stock indices. Gold is not only a refuge for markets but also a source of liquidity — when stocks plunge, investors sell bars to cover losses elsewhere.
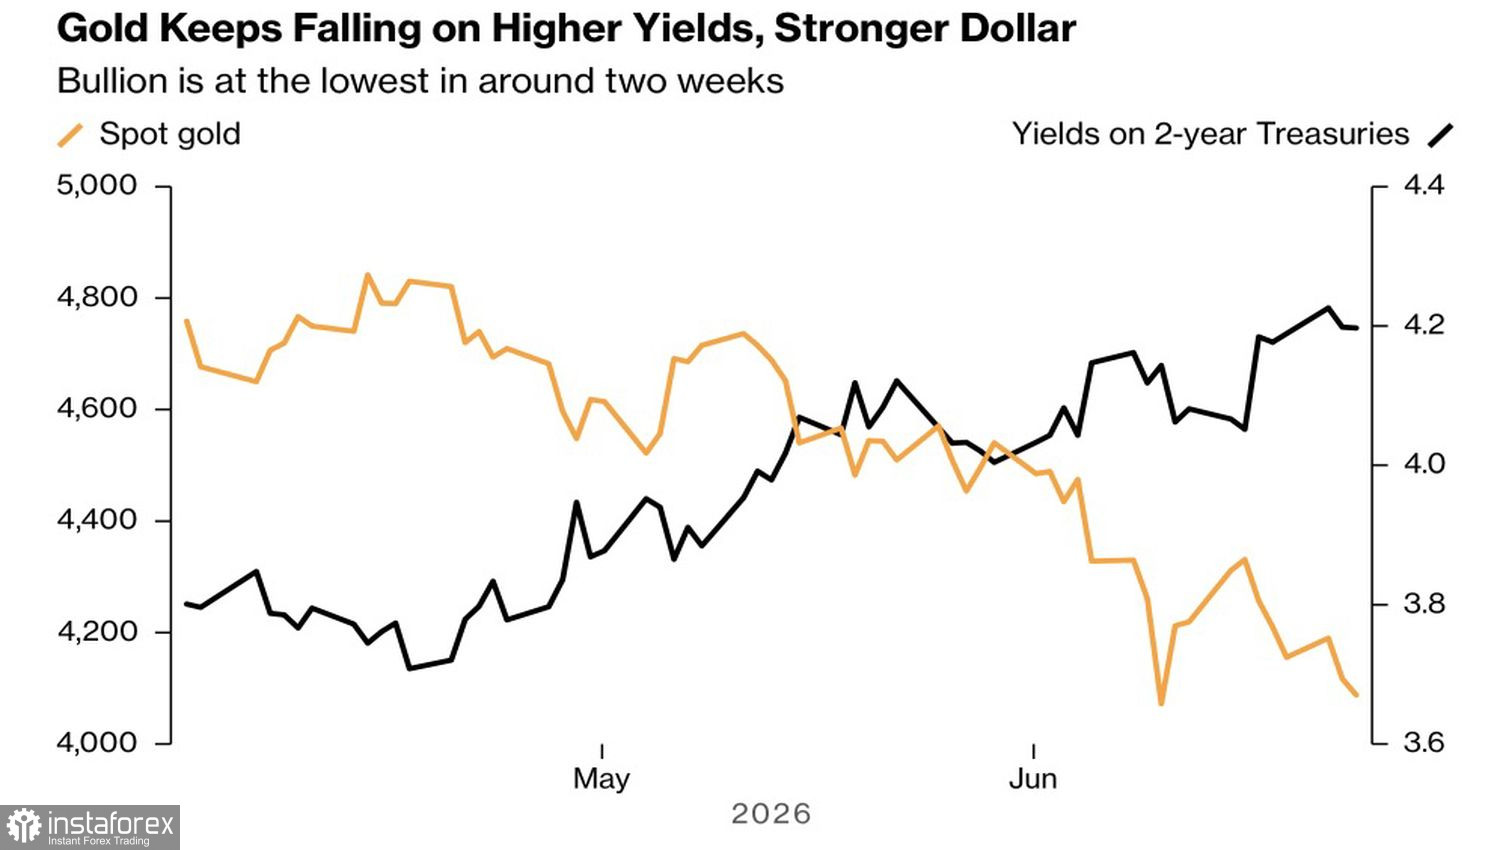
A strong dollar and the US tech rout have created a perfect storm for XAU/USD. Pressure is compounded by inflation risks and the growing likelihood that central banks will hold rates steady rather than cut them. The futures market is pricing in the Fed moving to tighten policy as soon as September — if not July. Non-yielding gold underperforms US Treasuries when yields rise. The jump in 2-year Treasury yields to levels not seen since February 2025 is a headwind for the metal.
Gold and Treasury yield dynamics
Under these conditions, major banks are mass-revising their gold forecasts. Deutsche Bank cut its Q3 target to $4,300/oz and Q4 to $4,800/oz. The bank says a reassessment of Fed prospects, together with strong US macroeconomic data, has been key to the metal's decline. If the Fed pauses, a $4,800 target remains relevant; with three to four rate hikes, XAU/USD risks sliding to $3,800.
Goldman Sachs has been more cautious, trimming its full-year forecast by $500 to $4,900/oz. Previously, the bank expected Fed rate cuts in March and September 2027; it has since pushed those dates for policy easing into September and December of next year. If the Fed tightens policy, gold could fall to $4,400/oz. Macquarie Group lowered its targets to $4,450 and $4,300, citing an end to the Middle East conflict and hawkish Fed rhetoric — a backdrop that saps safe?haven appeal.
Not all drivers are bearish for XAU/USD. China boosted gold imports in May to around 163 tonnes — a two?year high — and year?to?date volumes are up 76%. Over the first five months of 2026, imports reached 692 tonnes, 76% higher than the same period last year. Demand from the world's largest buyer of physical gold does not square with banks' pessimism. Time will tell who's right.
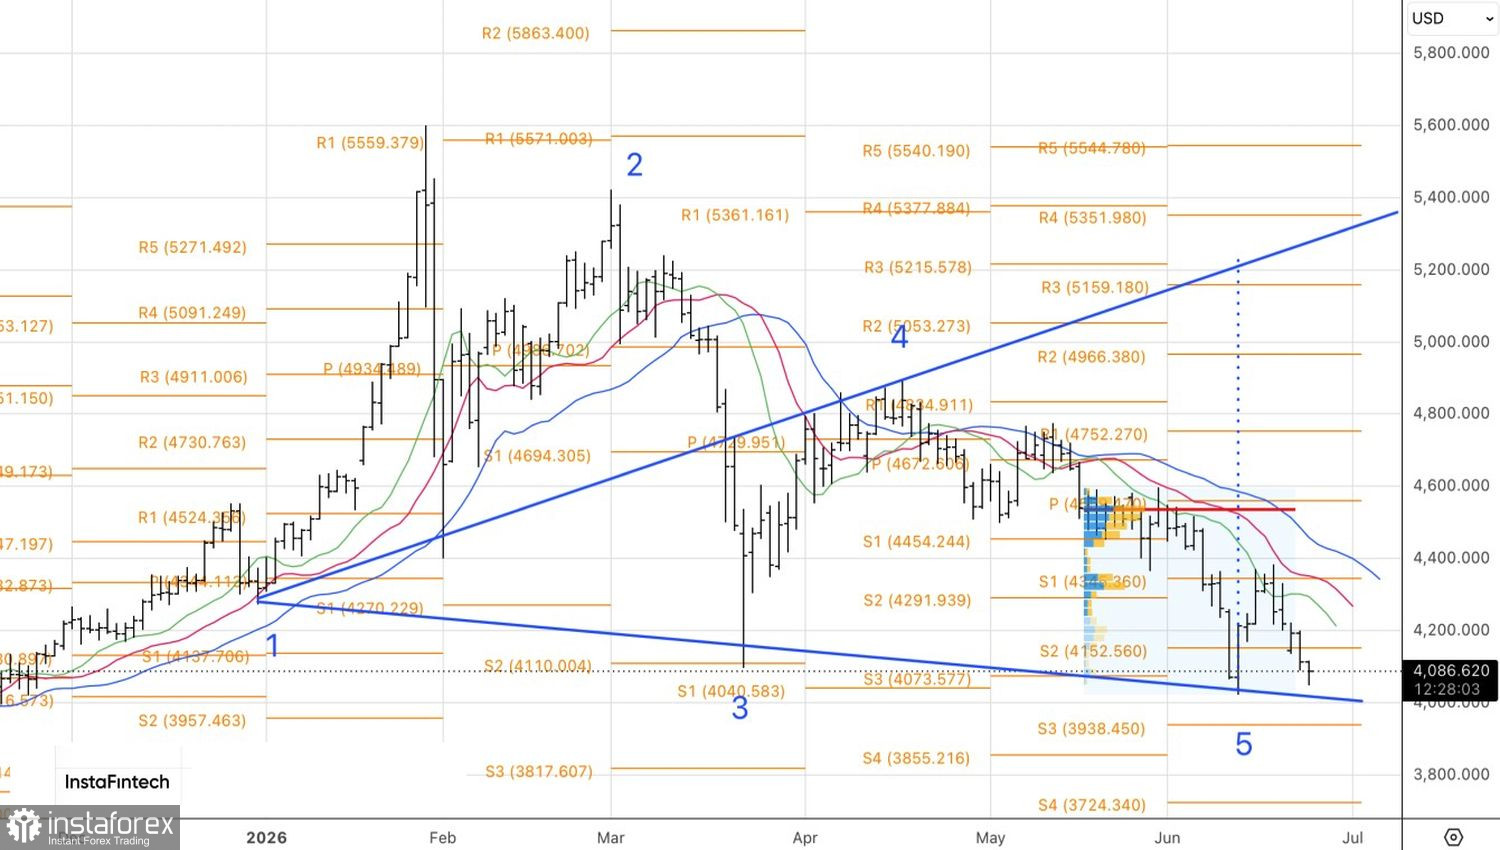
Technically, Wolfe Wave formations on the daily gold chart are still possible, but now their appearance hinges on either a Double Bottom or an Anti-Turtles pattern forming. In the first scenario, a bounce off support at $4,070 and $4,040/oz would be a basis for buying. In the second, traders should wait for a break of the June low, followed by a decline and then a recovery back above that low, before considering long positions.


