আরও দেখুন

 18.03.2026 07:40 AM
Bitcoin spent a long time stuck in a 60,000–75,000 range, yet during the Middle East conflict, it has outperformed both gold and US equity indices. Does that mean the crypto has decided its next directional leg? Not necessarily. It may simply have been oversold and now looks cheap — buy the dip, sell the rally?
Bitcoin's edge over precious metals and the S&P 500 has revived talk of crypto's potential role as a safe haven amid geopolitical shocks. However, the digital asset has lagged oil badly — largely because crude volatility exploded on the back of the Middle East crisis.
Oil and BTC volatility dynamics
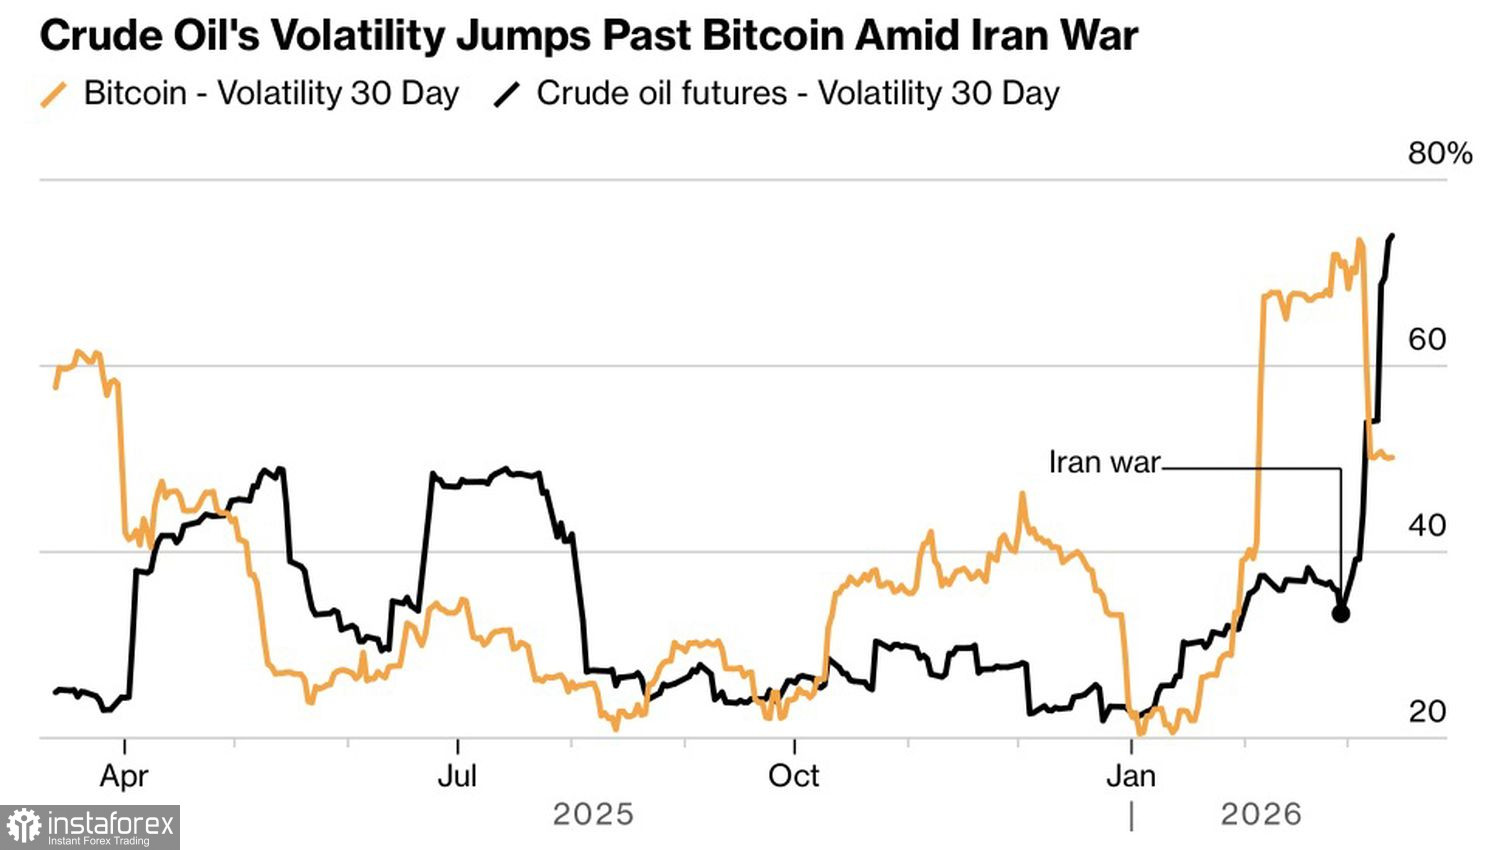
The collapse in volatility that once punished BTC/USD has reversed. Earlier this year, Bitcoin had trailed US equities so decisively that investors questioned its role as a risk asset. The strikes on Iran by Israel and the US changed that calculus.
Despite a longer confrontation than initially expected, money has flowed into crypto-oriented ETFs. In the week to March 13, specialized ETFs attracted $763m — the third consecutive five-day inflow. Over that stretch, institutional holdings rose by about $1.3bn.
Flows into Bitcoin ETFs
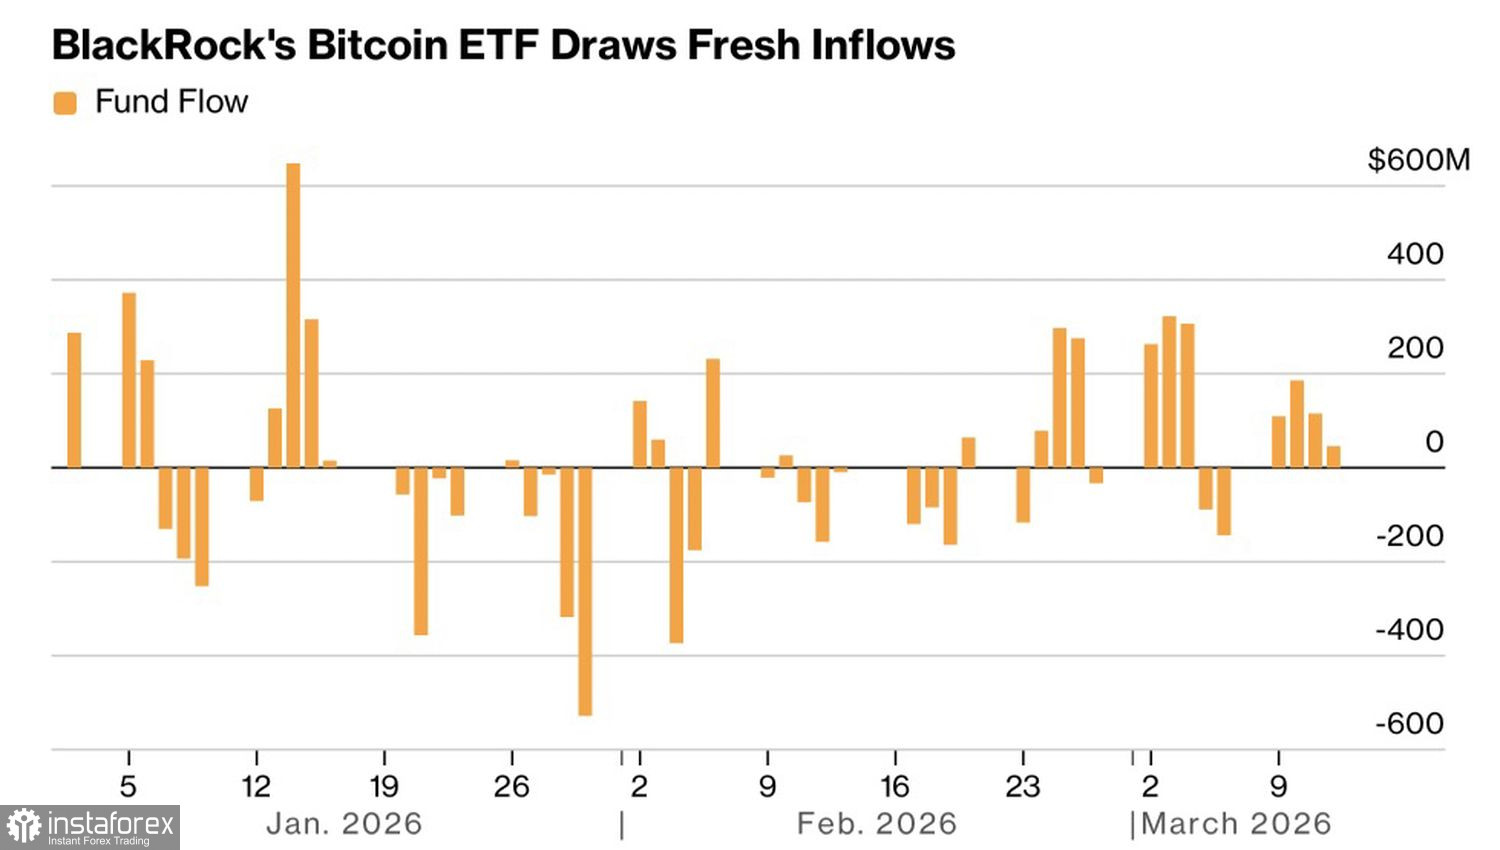
Roughly 78% of those inflows went to BlackRock's IBIT, suggesting this is persistent demand rather than simple rotation between ETFs.
At the same time, funding rates for holding positions in crypto markets remain negative — shorts are paying to hold their trades. That backdrop points to residual bearish sentiment in the digital asset complex.
Optimists argue that Bitcoin could quickly spike above $100,000 if the Middle East conflict ends soon, as President Trump has suggested. In that scenario, the S&P 500 and other stock indices would likely rally, boosting global risk appetite and supporting BTC/USD bulls. However, Polymarket currently estimates the probability of peace between the US, Israel, and Iran by the end of May at less than 50%.
A protracted conflict could trigger stagflation or a global recession — a tailwind for gold. Flows into precious metals could slow Bitcoin's buyers. In 2025 and early 2026, we observed a shift in capital flow and a decline in the crypto market.
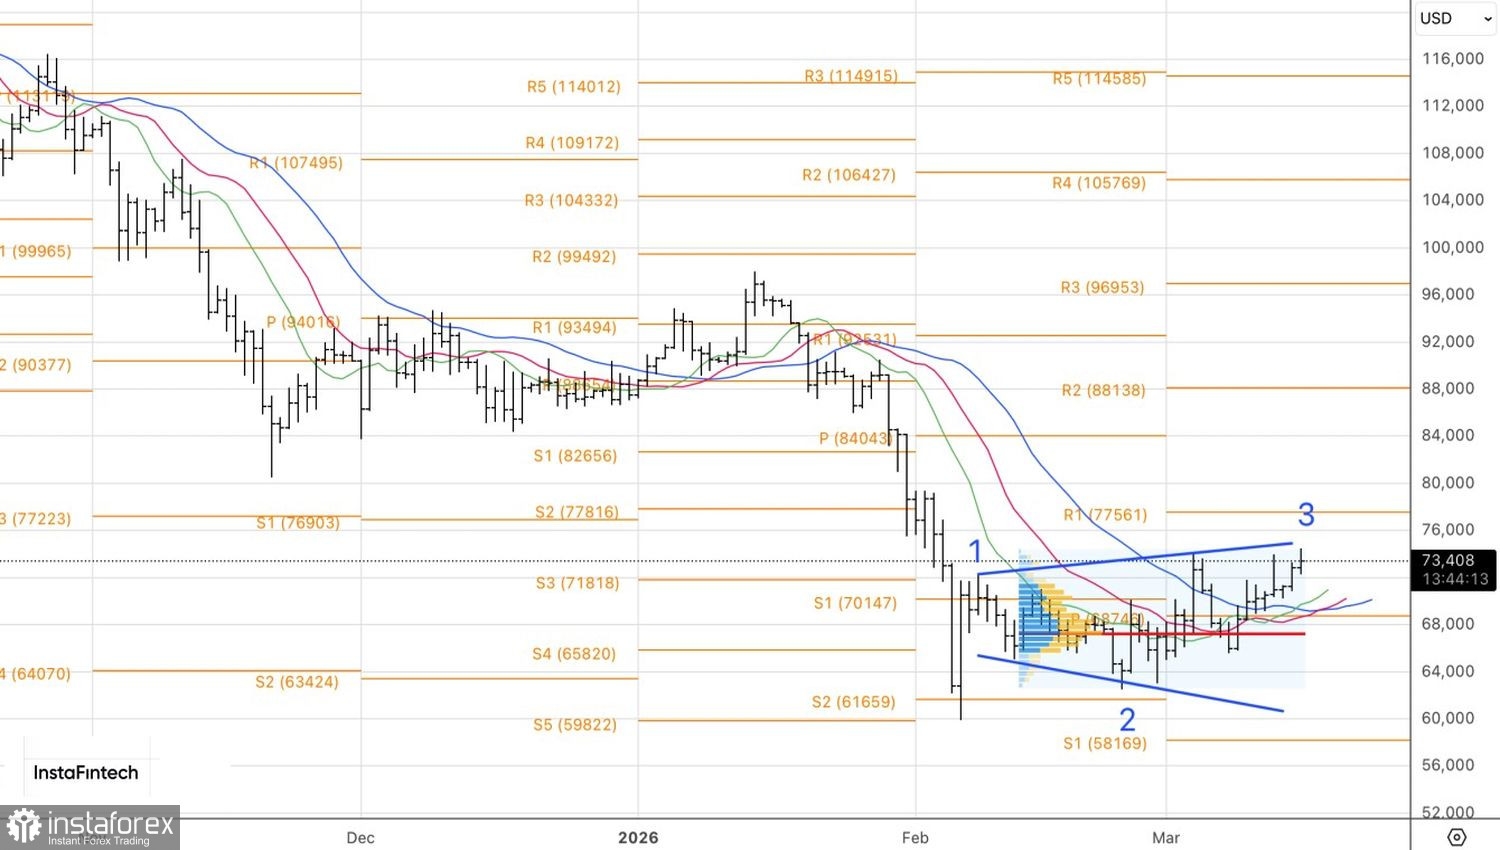
Technically, the daily BTC/USD chart shows that a pin bar with a long upper wick was not activated, and the price returned to its high. That structure signals weakness among bears and provides a basis for building long positions — at least while Bitcoin trades above 70,150.


