یہ بھی دیکھیں

 07.04.2026 07:39 AM
The situation in the cryptocurrency market remains the same. On the daily time frame, it is still a sluggish and weak upward correction, while on the 4-hour time frame, it is 80% flat with a minimal upward bias. At this time, there is no clear flat, and there is no trending movement on the 4-hour time frame either, which further complicates the trading process. We are observing a hybrid of an extremely weak upward trend and a flat market. Recent movements resemble not so much a flat as a random pattern, similar to what we see in the currency market. Prices are swinging back and forth, and traders cannot decide what to do next. On the 4-hour time frame, Bitcoin has tested the lower boundary of the sideways channel and formed a deviation, making the current rise of the first cryptocurrency justified. As much as we might want otherwise, the flat continues.
In the meantime, it has become known that Strategy has bought nearly 5,000 additional Bitcoins for approximately $330 million. The average price of the purchased coins was $67,700. As we can see, Michael Saylor's company has remained true to its main strategy over the last six years, which is not focused on software development. Thus, the total number of Bitcoins on the company's balance sheet has reached 767,000. Interestingly, since 2020, the company has invested around $58 billion in Bitcoin, with an average purchase price of $75,600 per coin. Therefore, Strategy's Bitcoin investments are currently unprofitable. Of course, if Bitcoin rises to $100,000 or $1 million, the company will make a huge profit, but judging by recent news, only Saylor's company is now buying Bitcoin.
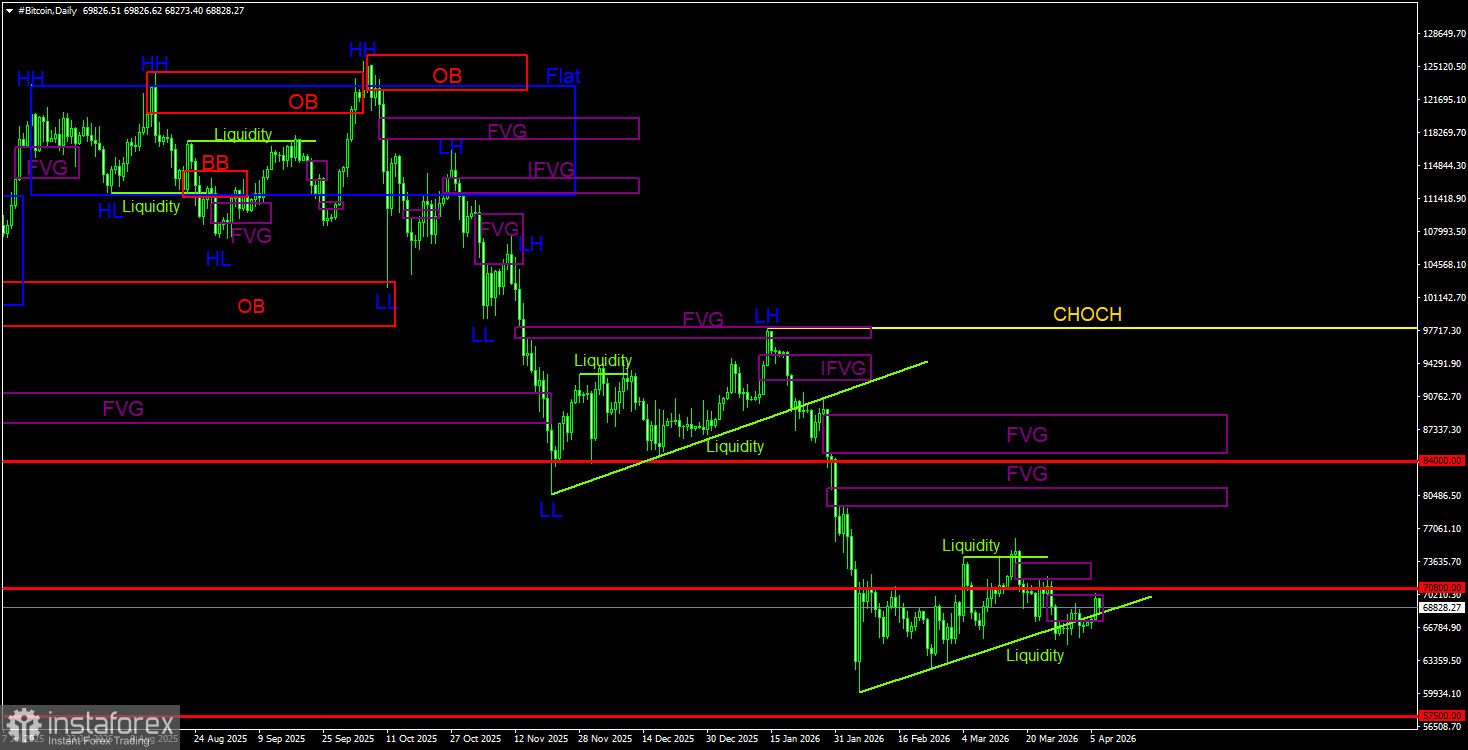
On the daily time frame, Bitcoin continues to form a downward trend. The trend structure is identified as descending, while the CHOCH line remains at $97,900. Only above this level can it be considered that the downward trend has ended. The last sell signal was formed within the "bearish" FVG ($96,900 – $98,000). Thus, traders had a great opportunity to capture almost the entire recent downward movement. For now, all we can do is wait. Given no signs of a trend reversal to the upside, we believe the decline will resume. On the daily time frame, the nearest area of POI for new sell trades is within the range of $79,500 – $81,100. During the current decline, two bearish FVGs were formed, with preliminary liquidity removal for sales; however, the flat on the 4-hour time frame prevented the price from going further down.
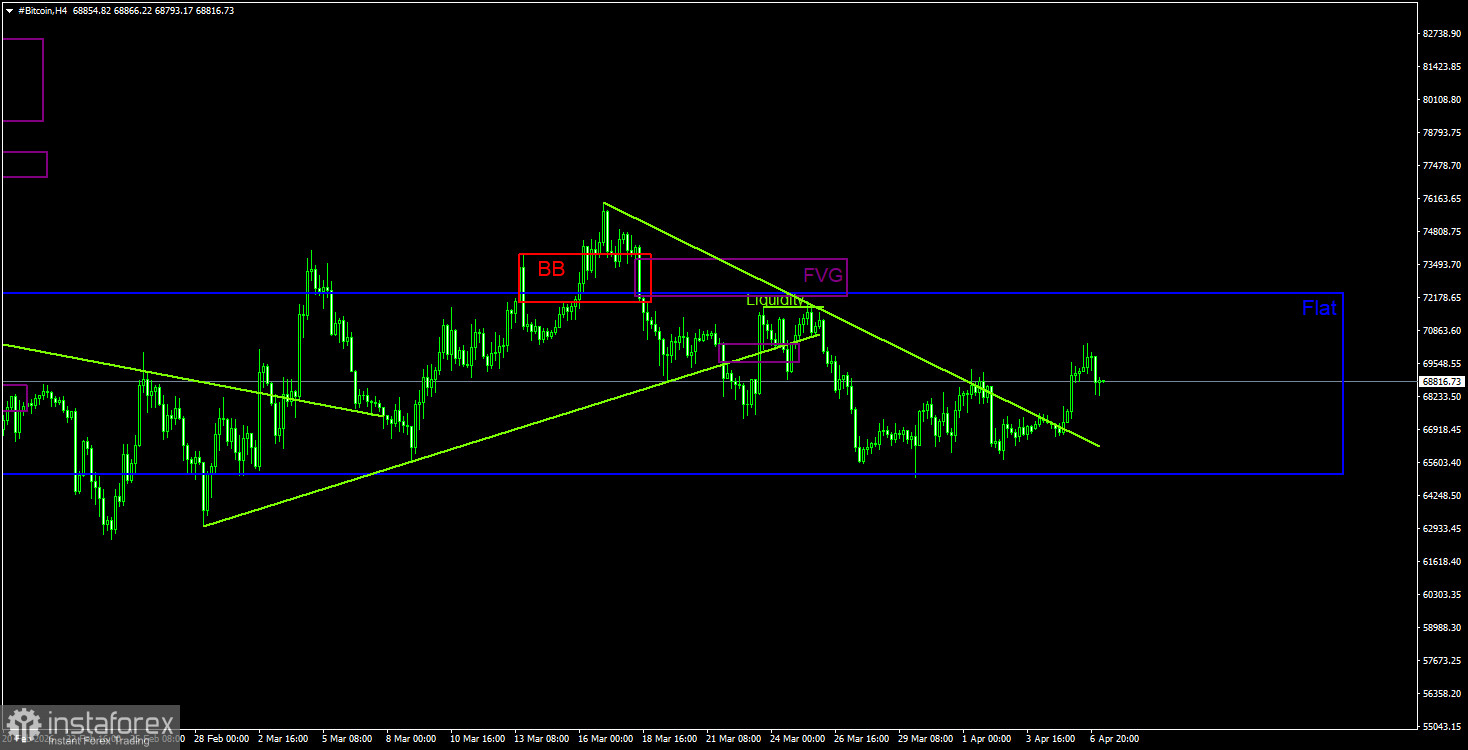
On the 4-hour time frame, the price has dipped to the lower boundary of the sideways channel, formed a deviation/bounce from it, and is now heading back toward the channel's upper boundary. The area above the descending trendline (the liquidity pool) is an excellent target. If the flat persists, internal patterns do not matter. We currently trust the daily chart more, but the flat on the 4-hour time frame determines the direction and strength of the movement. Once the flat ends, attention can be shifted to the daily time frame.
Bitcoin continues to form a full-fledged downward trend and a correction against it. We continue to expect a decline targeting $57,500 (the 61.8% Fibonacci level from the three-year upward trend), and there are currently no signs of a trend reversal. However, even the level of $57,500 does not now appear to be a final stop. Among the current POI areas, the nearest bearish FVG on the daily time frame is located in the range of $79,300 - $81,200. On the 4-hour time frame, the nature of Bitcoin's movement once again shows all the signs of a flat, so only deviations of the boundaries of the sideways channel should be monitored.
CHOCH – the break of trend structure.
Liquidity – the liquidity and stop losses of traders that market makers use to build their positions.
FVG – Area of price inefficiency. The price passes through such areas very quickly, indicating a complete absence of one side in the market. Subsequently, the price tends to return and react from such areas.
IFVG – Inverted area of price inefficiency. After returning to such an area, the price does not receive a reaction from it but impulsively breaks through it and then tests it from the other side.
OB – Order block. The candle on which the market maker opened a position with the goal of taking liquidity to form their own position in the opposite direction.


