
Lihat juga


 25.08.2026 08:00 AM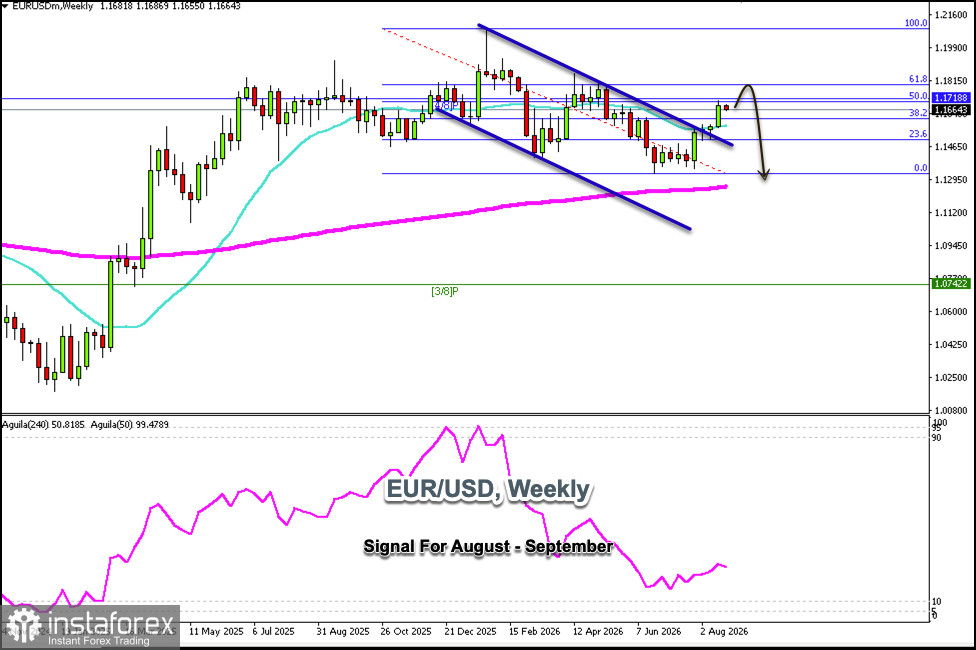
The weekly chart for the EUR/USD pair shows that it is trading around 1.1664 and, according to the Fibonacci indicator, has reached the 50% retracement level from its high of 1.20 on December 21 to its low on June 7.
The euro could continue to rise in the coming days until it reaches the 61.8% Fibonacci level around 1.1815. If the euro remains below the 4/8 Murray level, as seen on the weekly chart, there could be strong downward pressure below 1.1718, and we could expect a technical correction in the coming weeks, potentially reaching the 23.6% Fibonacci level around the psychological level of 1.15.
Given that the trend remains bearish, we expect the euro to undergo a technical correction in the coming days. EUR/USD could continue to fall if the price consolidates below the 21-day SMA, potentially reaching the 200-day SMA around 1.1220.
If bullish momentum prevails, we should expect a decisive break above 1.1718, after which the currency pair would face strong resistance at the 61.8% Fibonacci level; this zone could also be considered a point to open short positions.
Our outlook for the coming weeks will remain bearish below the 4/8 Murray level, and we could sell in anticipation of the price reaching the 1.13-zone in a couple of months.
You have already liked this post today
* Analisis pasaran yang disiarkan di sini adalah bertujuan untuk meningkatkan kesedaran anda, tetapi tidak untuk memberi arahan untuk membuat perdagangan.


