
यह भी देखें


 14.08.2026 04:26 AM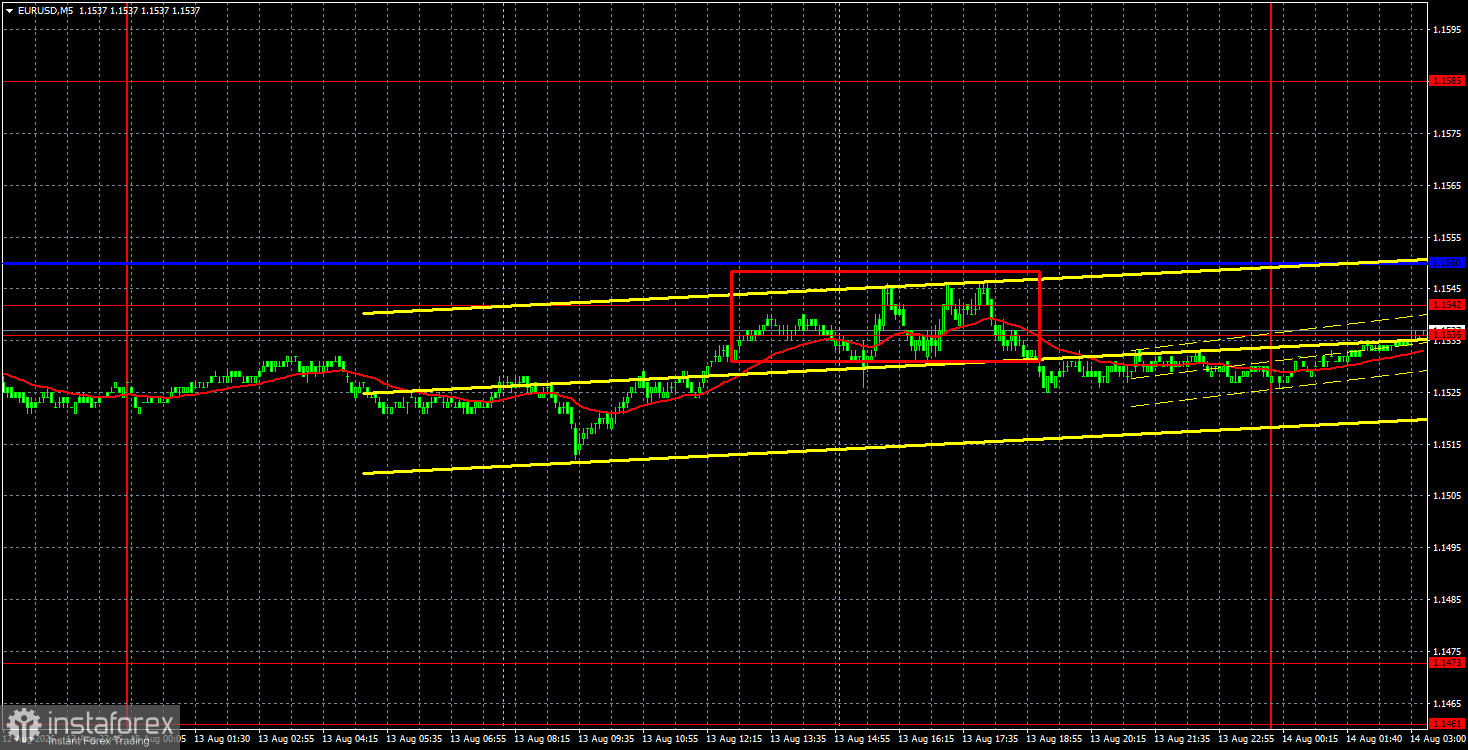
On Thursday, August 13, the EUR/USD currency pair again showed no notable movement or volatility. In principle, the pair has not been moving at all this week. Even on Wednesday, when an important US Consumer Price Index was published, we saw no interesting movements. What can be said about other, less important reports and events and the market's reaction to them? For example, yesterday the European Union's industrial production report was published, which, as usual, came in worse than expected. There was no market reaction. The US Producer Price Index, which many experts consider an important indicator, showed a 0% reading, below forecasts and further reducing the probability of Federal Reserve monetary policy tightening in the foreseeable future. Market reaction — a 15-pip fall in the dollar. Traders are currently forced to be content with exactly such movements and such reactions. It is extremely difficult to earn on such movements even on lower TFs, because there are virtually no movements. In our view, the European currency retains a positive upward bias, but for it to continue, the market needs to wake up.
In technical terms, the pair left the sideways channel 1.1362–1.1461 after a month of "walking through torment" and is now in an upward trend that threatens to turn into another flat. The European currency remains close to its local highs, but growth over the last week and a half has practically ceased. The dollar currently has no trumps in hand. It is only saved by the fact that it is the world's most popular currency, which, a priori, cannot fall every day.
On the 5-minute TF on Thursday, one sell trading signal was formed that made no sense to trade, as with all signals this week, due to the lack of movement.
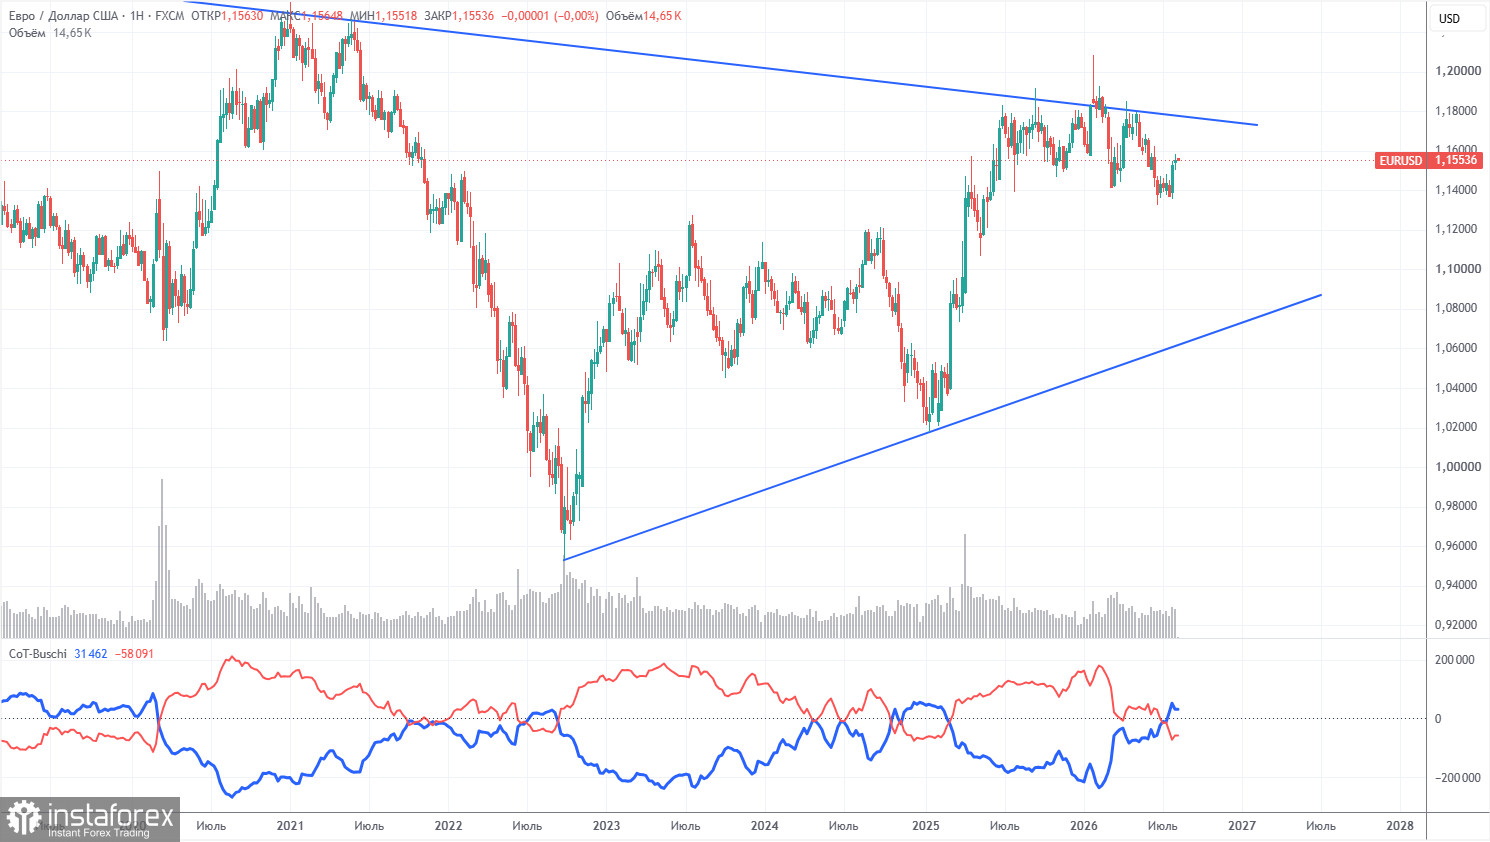
The latest COT report is dated August 4. In the weekly TF illustration, it is clear that the net position of non-commercial traders has become "bearish" and has significantly decreased in 2026 due to geopolitical events. Traders have been disposing of the European currency in recent months in favor of the US dollar. Donald Trump's policy has not changed, but the dollar has, for a while, acted as the "reserve currency."
We still do not see any fundamental factors to strengthen the European currency, while there remain sufficient number of factors for the US currency to fall. The war in the Middle East made the dollar temporarily super-attractive, but when this factor's "shelf life" expires, everything will return to normal. In the long term, the euro can fall as low as $1.08 (trend line), but the upward trend will remain relevant. And during the recent months of dollar growth, the pair did not approach that line too closely.
The positions of the red and blue lines of the indicator indicate parity between bulls and bears. During the last reporting week, the number of longs in the "Non-commercial" group decreased by 3,100, and the number of shorts decreased by 17,500. Accordingly, the net position for the week increased by 14,400 contracts.
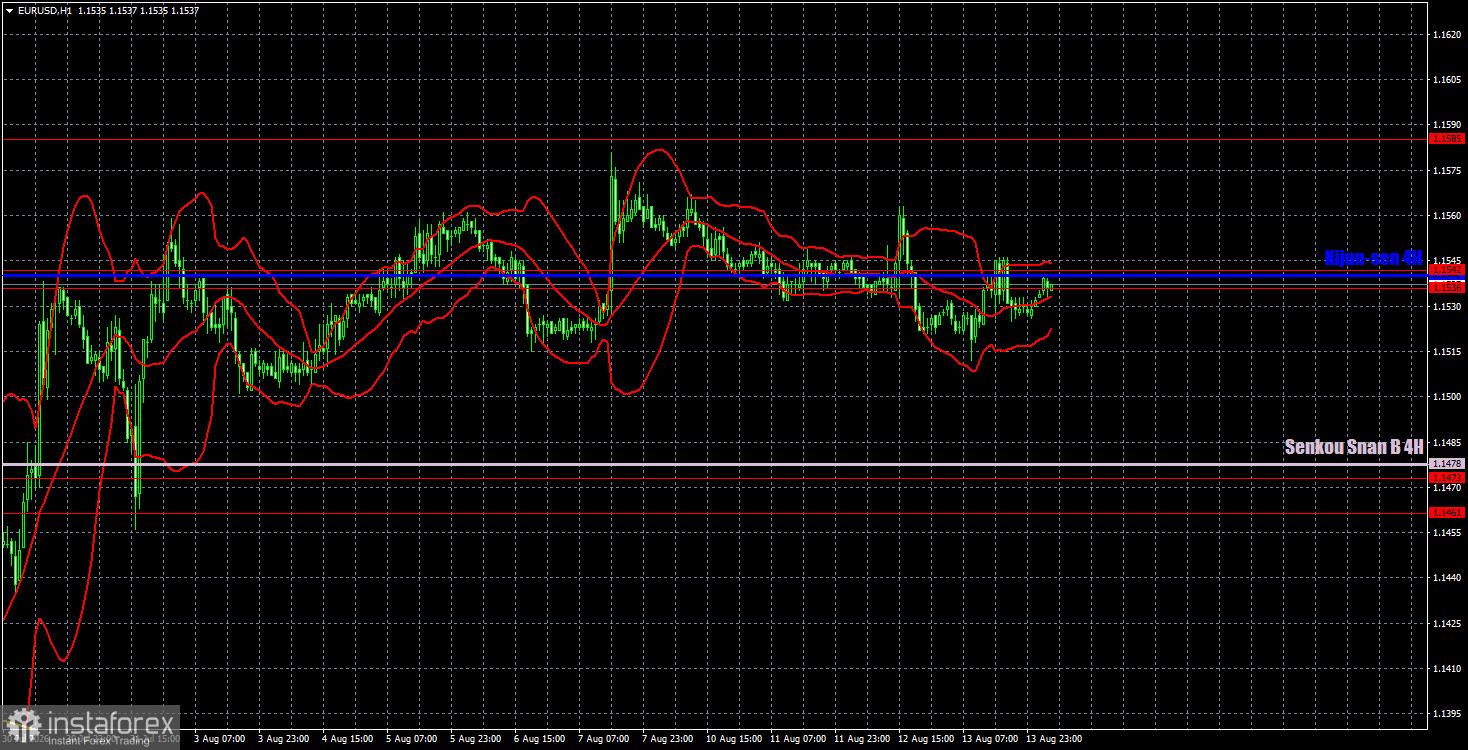
On the hourly timeframe, the pair maintains an upward trend, but in recent days it has been completely immobilized. The situation in the Middle East remains tense and is not improving, but this is no longer sufficient for a new, powerful rise in the dollar. In recent months, the market ignored all positive euro-related factors and focused only on Fed monetary policy, to which it made excessive demands. Now the veil is lifting from traders' eyes, so the European currency has every chance of medium-term growth.
For August 14 we highlight the following levels for trading — 1.1234, 1.1274, 1.1362–1.1368, 1.1461–1.1473, 1.1536–1.1542, 1.1585, 1.1657–1.1666, 1.1750–1.1760, 1.1786, 1.1830–1.1837, as well as the Senkou Span B line (1.1478) and the Kijun-sen (1.1541). The Ichimoku indicator lines may move during the day, which should be taken into account when determining trading signals. Do not forget to move the stop loss to breakeven if the price moves 15 pips in the correct direction. This will protect against potential losses if the signal proves false.
On Friday, the EU will publish Q2 GDP, and in the US — retail sales and the University of Michigan consumer sentiment index. US data could provoke a market reaction if the market is inclined to move at this time.
Today, traders may consider new short positions with targets of 1.1461–1.1473 if the pair bounces off the area of 1.1536–1.1542. But the chances of seeing a strong move are extremely small. A consolidation above the area 1.1536–1.1548 will allow opening longs with a target of 1.1585.
Price support and resistance levels (resistance/support) — thick red lines near which movement may end. They are not sources of trading signals.
The Kijun-sen and Senkou Span B lines — Ichimoku indicator lines — transferred from the 4-hour to the hourly timeframe. They are strong lines.
Extreme levels — thin red lines from which price previously bounced. They are sources of trading signals.
Yellow lines — trend lines, trend channels, and any other technical patterns.
Indicator 1 on the COT charts — the size of the net position of each category of traders.

